
Radial Tree and Zoomable Sunburst (Qlikview extensions) (Updated)

We have a project in which we are working with menu navigation data (more like parent-child relation / hierarchical data).
Although there are few approaches and solutions we've picked few visualisations that might be better to be used with our data.
We had our POC app build in Qlikview using only QV charts and the solutions looked ok. But we've decided to spend more time in this and bring some D3 charts in QV.
At the moment I've brought to live two extensions based on: Radial Tree and Zoomable Sunburst with Labels
The Data
The data for both extensions is the same and looks like this: (notice the "-" in the root element)
	node	,	parent	,	value
	node 1	,	-       ,	1
	node 2	,	node 1	,	2
	node 3	,	node 1	,	3
	node 4	,	node 1	,	4
	node 5	,	node 1	,	5
	node 6	,	node 2	,	6
	node 7	,	node 2	,	7
	node 8	,	node 2	,	8
	node 9	,	node 7	,	9
	node 10	,	node 7	,	10
	node 11	,	node 3	,	11
	node 12	,	node 3	,	12
	node 13	,	node 3	,	13
	node 14	,	node 3	,	14
	node 15	,	node 13	,	15
	node 16	,	node 11	,	16
	node 17	,	node 11	,	17
	node 18	,	node 11	,	18
	node 19	,	node 16	,	19
	node 20	,	node 16	,	20
	node 21	,	node 8	,	21
	node 22	,	node 8	,	22
	node 23	,	node 6	,	23
	node 24	,	node 6	,	24
	node 25	,	node 4	,	25
	node 26	,	node 4	,	26
	node 27	,	node 5	,	27
	node 28	,	node 5	,	28
	node 29	,	node 5	,	29
	node 30	,	node 1	,	30
...
node - the actual note text
parent - parent node text
value - some value associated with the node
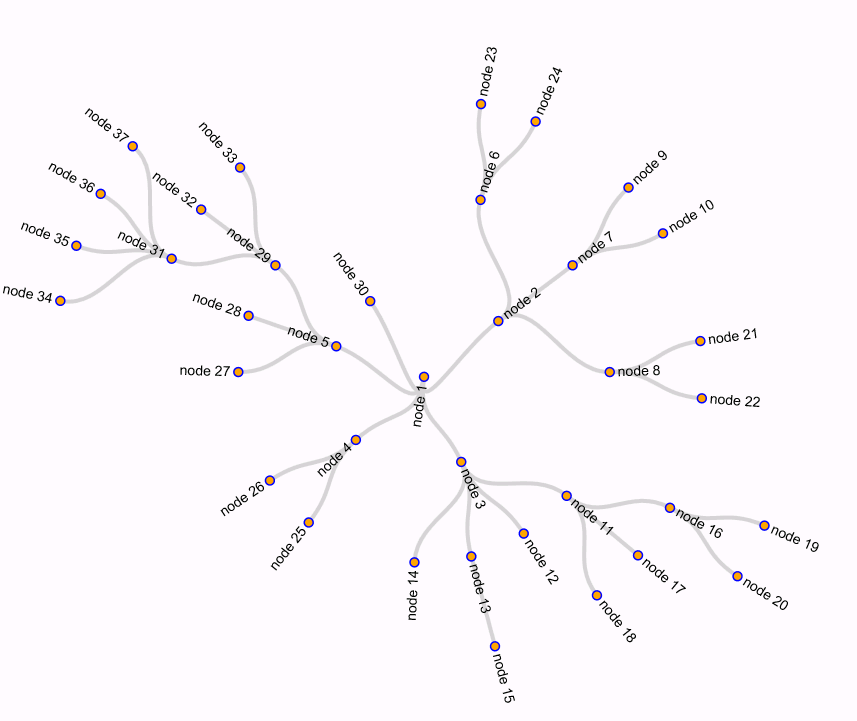
Radial Tree
The Radial Tree extension is already available in Qlik Branch and the source code is in GitHub
The extension is using the parent-child relationship to create tree looking hierarchy
I've tried to add as many options as I can:
- Rotation - this option control how round to be the tree. 360 (degree )= full circle
- Diameter
- Show values - if "true" will show the "value" field value next to the text
- Circle radius - radius of the node circle in px
- Circle fill - color fill for the circle. Accept human readable colors (like "red", "yellow") as well as HEC
- Circle stroke - circle stroke color
- Circle stroke width - stroke width in px
- Stroke color - color of the link lines between nodes
- Stroke width - link width in px
- Font size - in px
- Font family
Excluding the "Show value" all other options can be used from inside QV expression
Zoomable Sunburst
Another visualisation (using the same data) is the Zoomable Sunburst. This specific D3 example is already available in Qlik Branch thanks to @brianwmunz for Qlik Sense.
I've tried to create it but for Qlikview. The extension is still in development phase (but very close to initial release). You can get the latest source code from GitHub
Again I've tried to add as many options as possible:
- Font size
- Font family
- Color scheme - thanks to Cynthia Brewer you can pick from one of many coloring options
- Color Sub Scheme
- Opacity - transparency from 0 to 100
- Zoom speed (ms) - control the speed of zoom in/out
- Width
- Height
At the moment of writing of this post the below options are yet not available. But they will be in the next commit or two
- Border color - the border color of each arc
- Border width - arc border width
- Custom color scheme - comma separated list of custom Hex coded colors
The extension don't perform selection back to QV ... yet. I'm still evaluating the behaviour of the extension.
It's not visible in the gif above but the extension will not show the text if its too long. When level is reached where the arcs are bigger the text will be shown.
These two extensions was at the top of our list. I'll try and create 1-2 more (after the sunburst is released) from the list that I personally.
Update (2016-03-14)
I've made some changes to the Zoomable Sunburst based on the users feedback:
- Color expression - the color of the elements can be controlled with regular QV expression e.g.
if(value > 10, 'blue', 'green'). The colors can be defined inRGBorHEXformat - Tooltip - tooltop option is added. The text in it can be defined as QV expression as well like HTML string:
node & '<br/> <b>' & sum(value) & '<b>'
Hope you like it!
Stefan