Wearable Qlikview
While waiting for my new and shiny Pebble Time I've finally managed to spend some time and play with Pebble API. And of course one of the first questions was is it possible to make a link between Pebble and Qlikview/Qlik Sense.
Since I'm more familiar with Qlikview QMS API I've started with it.
Limitations
- Display - since Pebble display is black and white showing charts is kinda obsolete (will check with the color Pebble Time display later). That's why I've decided to try and show only number based reports.
- API - Qlikview API is limited when you try and get data from qvw. The only method I've found was to get specific field content. But think that this is enough since I don't need complicated data. (Qlik Sense API on other side provide more options - building calculation on the fly, get data from objects etc.)
Workflow
The overall idea/workflow that worked for me is:
- Qlikview app(s) holding the data
- .net app (QV API only supports .net) which will take care of the communication with QV
- web server that will link Pebble requests with the .net app
- Pebble app that will display data
Qlikview app (qvw)
The only data that make sense to be used in this case is simple KPIs: Sales amount: £140, Revenue: £50 etc.
For this reason the QV app should contain one extra script part that will calculate this static data.
The values in the field should be separated by "_".
.net app (c#)
The app is console app that accept two arguments:
- Qlikview server - in format http://localhost:4799/QMS/Service
- Apps and fields - from which qvw files which fields data to be get. Format:
, ; , (for example C:\ProgramData\QlikTech\Documents\PebbleData.qvw,PebbleData;C:\ProgramData\QlikTech\Documents\PebbleData1.qvw,PebbleData1;)
More help is available if the app is started with --help argument.
Pebble app
The app will display the result based on the returned data and will generate the screen title and navigation on the fly.
If we have the following data in QV:
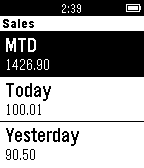
Sales_MTD_1426.90
Sales_Today_100.01
Sales_Yesterday_90.50
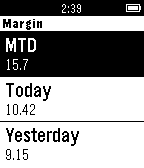
Margin_MTD_15.7
Margin_Today_10.42
Margin_Yesterday_9.15
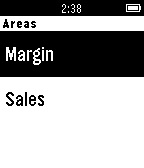
The pebble app will create two main categories: Sales and Margin and each category, when selected, will show 3 rows (MTD, Today and Yesterday) and each row will show the corresponding value.
Pebble app configuration
The app uses configuration html file which is hosted in Google Drive. This file do not store any data. It contains 3 fields that need to be populated:
- Web server - url for node.js app
- Qlikview server - targeted QV server
- Qlikview files and fields - required QV files and fields
You need to enter all 3 values every time change is made (for now).
https://googledrive.com/host/0BxjGsOE_3VoOU2RPQ3BjTlBfX0E
Repo
The code is available at https://github.com/countnazgul/QlikviewToPebble.
This project contains all files. Nodejs and Pebble app can be found in the main folder
Screenshots
Main screen:

Margin selected:

Sales selected:

Feature
-
Of course Qlik Sense will be the first try. Alexander Karlsson's QSocks (https://github.com/mindspank/qsocks) is very nice project which can be used to handle the communication between Node.js and Qlik Sense
-
Pebble time - at the moment Javascript is not supported for Pebble SDK 3 (for now) and I'm not a C developer so as soon Pebble.js is available will try and build something for Pebble Time. Adding color to Time clear the area for more visual integration.
-
Not only Pebble - most of the other smart watches have touch displays. Navigation is only one "+" when thinking of BI/reporting integration. I will play, in the near future, with Android Wear at least.
Warning
This is just proof of concept project. Some parts might not work from first time.
It's not bad idea to be tested first against dev/test Qlikview server.
Hope you like it!
Stefan
