
QlikView script resources

My previous post was about little tool which is capable to show and export CPU and RAM usage of a specific Windows process.
I've used this tool to grab resource usage of QlikView during reload. Combining the exported csv file and QlikView log file I was able to build qvw file that shows resources per script part. So I was able to see which script part(s) grab the most of resources and try to optimize it.
Here is a few screenshots from the qvw file:
Overall
With the CPU/RAM sliders you can set the amount above which the values will be marked as above threshold.
The imput boxes are used to specify the location of the csv and log files.
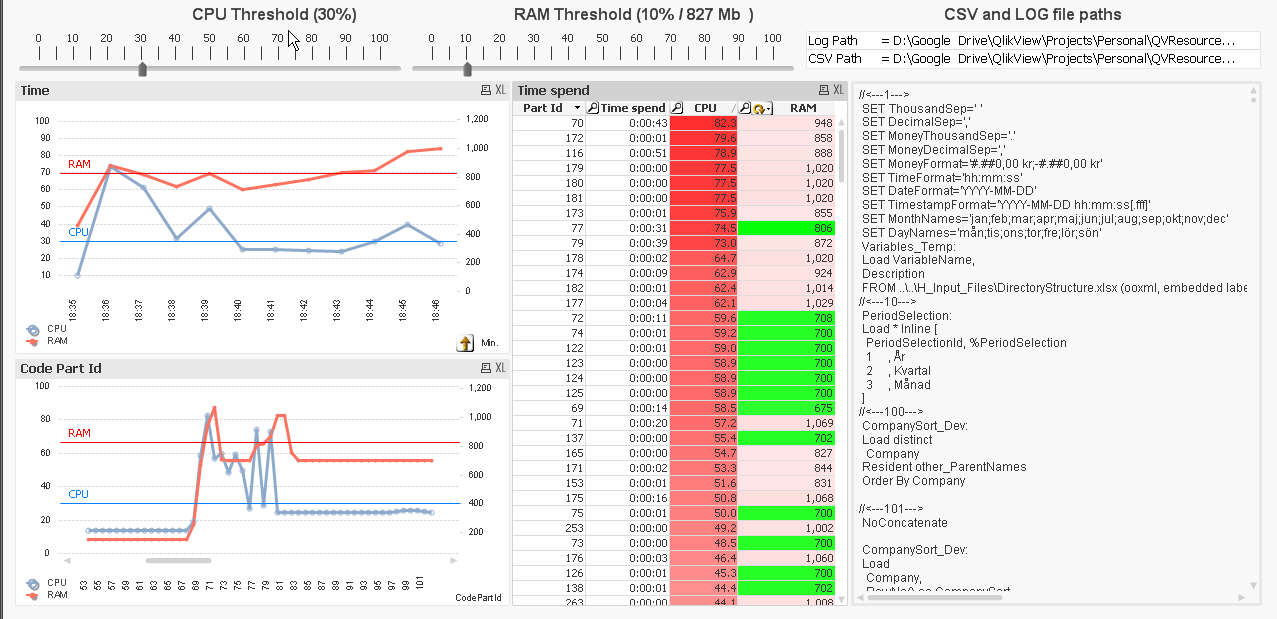
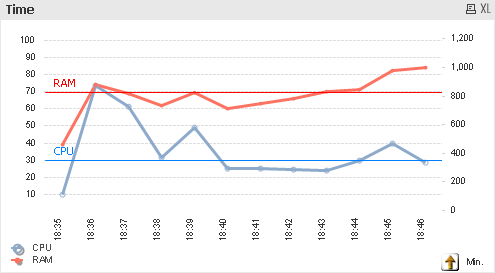
CPU/RAM usage per time
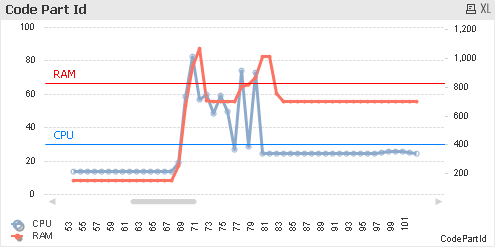
CPU/RAM usage per code part id
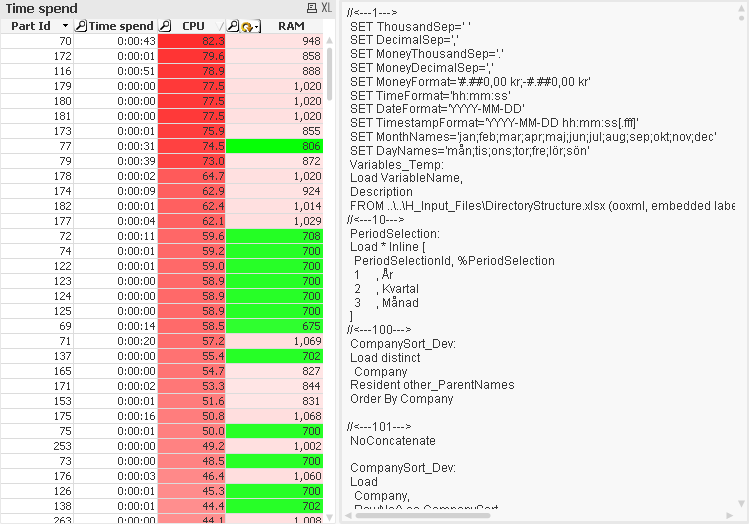
Code parts time execution
The table give you an info about each part time execution, cpu, ram/ram% usage. Also the colors indicate the high usage parts.
The script is on the right part. Selectind some partId will show you the exact code. So sorting and filtering the table will show you the parts that might need optimization.
Need to clear the script first and will publish the qvw file.
Hope you like it!
Stefan